Nagios는 다양한 호스트와 서비스를 모니터링할 수 있는 오픈 소스 도구로, 서버, 네트워크 장비 등 여러 인프라 요소의 상태를 실시간으로 확인하고 문제 발생 시 빠르게 대응할 수 있도록 돕습니다. 이번 글에서는 다른 호스트에 대한 모니터링 설정 방법을 중점적으로 다루고, 추가적으로 Podman을 활용한 localhost 환경의 컨테이너 모니터링까지 확장하여 소개하겠습니다.
host는 알아서 생성해주세요. 통신이 되는상태로
HOST 생성후
# wget http://www.nagios-plugins.org/download/nagios-plugins-2.0.3.tar.gz# sudo yum update -y
# sudo dnf install epel-release -y
# sudo dnf install nrpe -y# sudo /usr/local/nagios/bin/nagios -v /usr/local/nagios/etc/nagios.cfg
다시 Nagios서버로 돌아가서
Nagios에서 호스트를 정의
hosts.cfg
define host{
    use                     linux-server
    host_name               remote-server
    alias                   Remote NRPE Server
    address                 192.168.1.20    ; NRPE 서버의 실제 IP 주소
    max_check_attempts      5
    check_period            24x7
    notification_interval   30
    notification_period     24x7
}
Nagios에서 서비스를 정의
특정 호스트에서 모니터링할 서비스(예: PING, CPU 사용률, 메모리 상태 등)를 정의하고, 어떻게 모니터링할 것인지 명시합니다.
services.cfg
###############################################################################
#
# SERVICE DEFINITIONS
#
###############################################################################

# Define a service to "ping" the local machine

define service {

    use                     generic-service           ; Name of service template to use
    host_name               remote-server
    service_description     PING-RM
    check_command           check_ping!100.0,20%!500.0,60%
}


# Define a service to check the disk space of the root partition
# on the local machine.  Warning if < 20% free, critical if
# < 10% free space on partition.

define service {

    use                     generic-service           ; Name of service template to use
    host_name               remote-server
    service_description     Root_Partition-RM
    check_command           check_local_disk!20%!10%!/
}


# Define a service to check the number of currently logged in
# users on the local machine.  Warning if > 20 users, critical
# if > 50 users.

define service {

    use                     generic-service           ; Name of service template to use
    host_name               remote-server
    service_description     Current_Users-RM
    check_command           check_local_users!20!50
}


# Define a service to check the number of currently running procs
# on the local machine.  Warning if > 250 processes, critical if
# > 400 processes.

define service {

    use                     generic-service           ; Name of service template to use
    host_name               remote-server
    service_description     Total_Processes-RM
    check_command           check_local_procs!250!400!RSZDT
}


# Define a service to check the load on the local machine.

define service {

    use                     generic-service           ; Name of service template to use
    host_name               remote-server
    service_description     Current_Load-RM
    check_command           check_local_load!5.0,4.0,3.0!10.0,6.0,4.0
}


# Define a service to check the swap usage the local machine.
# Critical if less than 10% of swap is free, warning if less than 20% is free

define service {

    use                     generic-service           ; Name of service template to use
    host_name               remote-server
    service_description     Swap_Usage-RM
    check_command           check_local_swap!20%!10%
}


# Define a service to check SSH on the local machine.
# Disable notifications for this service by default, as not all users may have SSH enabled.

define service {

    use                     generic-service           ; Name of service template to use
    host_name               remote-server
    service_description     SSH-RM
    check_command           check_ssh
    notifications_enabled   0
}


# Define a service to check HTTP on the local machine.
# Disable notifications for this service by default, as not all users may have HTTP enabled.

define service {

    use                     generic-service           ; Name of service template to use
    host_name               remote-server
    service_description     HTTP-RM
    check_command           check_http
    notifications_enabled   0
}
Nagios의 메인 구성 파일
nagios.cfg
cfg_file=/usr/local/nagios/etc/objects/hosts.cfg
cfg_file=/usr/local/nagios/etc/objects/services.cfg
이걸 설정해야 페이지에 동작하는지 안하는지 나옵니다.
Nagios 페이지 접속
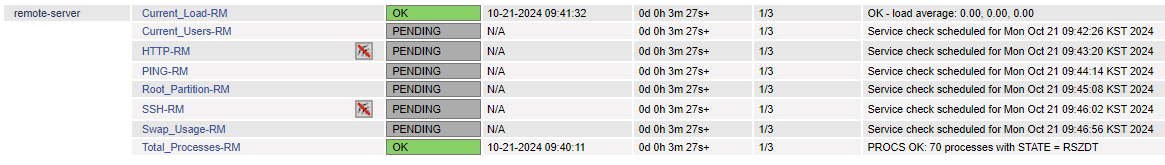
시간지나면 짠

+ podman (localhost)
# podman ps
podman이 실행중이다 가정하에
localhost.cfg
define service {
    use                     generic-service
    host_name               <Podman 컨테이너 IP>
    service_description     Podman ecstatic_jennings HTTP Check
    check_command           check_http!-p 8081
}
8082도 알아서 추가해보자
가짜인지 진짜인지 테스트
# podman stop <container_name_or_id>
크흑ㅠ 진짭니다

혹여나 나는 안되는거 같은데? 하면 시간 기다리기
Podman 컨테이너가 정지되었음에도 불구하고 Nagios에서 HTTP 상태가 여전히 OK로 표시되는 문제는, Nagios가 해당 서비스에 여전히 연결할 수 있거나 이전 결과를 캐싱해서 제공하고 있기 때문일 수 있습니다. 이를 해결하기 위해서는 check_interval이나 retry_interval 값을 줄여서 모니터링 주기를 더 짧게 설정하는 방법이 있습니다.
define service {
    use                     generic-service
    host_name               <Podman 컨테이너 IP>
    service_description     Podman ecstatic_jennings HTTP Check
    check_command           check_http!-p 8081
    check_interval          1
    retry_interval          1
}
비고
/usr/local/nagios/etc/nagios.cfg
/usr/local/nagios/etc/objects/command.cfg
/usr/local/nagios/etc/objects/hosts.cfg
/usr/local/nagios/etc/objects/localhost.cfg
/usr/local/nagios/etc/objects/services.cfg
Nagios는 강력하고 못생겼으며 마스터가 다 처리합니다.
Prometheus & Grafana 추천합니다.
'Nagios' 카테고리의 다른 글
| 이제 내 컴퓨터도 날 감시해! (0) | 2024.10.19 |
|---|---|
| Nagios에 오신 걸 환영합니다! (1) | 2024.10.14 |